Initiatives for Environment
Environmental Targets
CIM has formulated the "Energy Conservation Policy", the "Greenhouse Gas Emissions Reduction Policy", the "Water Saving Policy", the "Waste Management Policy" and the "Policy for Climate Change Related Issues" which stipulate efforts to reduce environmental impact in real estate investment management operations. Through the cycle of planning, implementation, performance management, and improvement set forth in the "Environmental Management System (EMS) Operation Manual" that stipulates the details for operating these policies, CIM will strive to continuously reduce the environmental impact.
In accordance with the Act on the Rationalization etc. of Energy Use (Energy Conservation Act), CIM sets the following quantitative targets for the continuous reduction of energy consumption throughout the portfolio.
- Long-term target 1: Reduce annual energy consumption intensity within the owner management scope (Note 1) by 5% in Fiscal Year 2029 from Fiscal Year 2024 levels (Each fiscal year is April to March of the following year. The same applies hereafter)
- Long-term target 2: Reduce the annual energy consumption intensity within the tenant management scope (Note 2) by 1% in Fiscal Year 2029 from Fiscal Year 2024 levels
Regarding greenhouse gas emissions, in accordance with the reduction target for energy consumption, the basic target for the adjusted scope 1+2 (Note 3) is to reduce the emission intensity by 5% in Fiscal Year 2029 from Fiscal Year 2024 levels. The basic target for the adjusted scope 3 (Note 4) and the adjusted scope 1+2+3 is to reduce the emission intensity by 1% in Fiscal Year 2029 from Fiscal Year 2024 levels.
Regarding water usage and waste volume, our target is not to increase each intensity level in the five years from Fiscal Year 2025 to Fiscal Year 2029 compared to Fiscal Year 2024 levels.
The Sustainability Committee compares target and actual values and appropriately considers measures to achieve each environmental target. The scope of the initiatives for reducing energy consumption and greenhouse gas emissions is the energy consumption through the use of lighting, air conditioning, and various facilities in INV's portfolio, specifically refers to 1) purchased electricity, 2) city gas/LP gas, etc., 3) heavy oil/kerosene/gasoline, etc., and 4) purchased steam, hot and cold water, and district heating and cooling etc. consumed on-site.
Progress towards the long-term targets in the five years from Fiscal Year 2020 to Fiscal Year 2024 is as follows.
Energy Consumption Intensity (MWh/㎡)
| FY2019 | FY2020 | FY2021 | FY2022 | FY2023 | FY2024 | |||||||
|---|---|---|---|---|---|---|---|---|---|---|---|---|
| YoY | YoY | YoY | YoY | YoY | Difference (vs 2019) |
Owner Management Scope (Note 1) | 0.094 | 0.093 | -0.7% | 0.092 | -1.6% | 0.088 | -3.8% | 0.084 | -5.0% | 0.082 | -2.1% | -12.5% |
| Tenant Management Scope (Note 2) | 0.328 | 0.260 | -20.7% | 0.274 | +5.2% | 0.299 | +9.3% | 0.300 | +0.2% | 0.305 | +1.8% | -7.0% |
Greenhouse Gas Emission (t-CO2eq) and Intensity (t-CO2eq/㎡)
| FY2019 | FY2020 | FY2021 | FY2022 | FY2023 | FY2024 | ||||||||
|---|---|---|---|---|---|---|---|---|---|---|---|---|---|
| YoY | YoY | YoY | YoY | YoY | Difference (vs 2019) |
||||||||
| Adjusted Scope 1 (Note 3) |
Total Amount | 21 | 21 | 0.0% | 17 | -19.0% | 17 | -1.5% | 12 | -27.0% | 14 | +12.2% | -34.6% |
| Intensity | 0.001 | 0.001 | 0.000 | 0.000 | 0.000 | 0.000 | |||||||
| Adjusted Scope 2 (Note 3) |
Total Amount | 738 | 706 | -4.3% | 702 | -0.6% | 659 | -6.0% | 633 | -4.0% | 600 | -5.2% | -18.8% |
| Intensity | 0.041 | 0.039 | 0.039 | 0.036 | 0.035 | 0.033 | |||||||
| Adjusted Scope 1+2 | Total Amount | 760 | 728 | -4.2% | 719 | -1.2% | 676 | -5.9% | 645 | -4.6% | 614 | -4.9% | -19.2% |
| Intensity | 0.042 | 0.040 | 0.040 | 0.037 | 0.036 | 0.034 | |||||||
| Adjusted Scope 3 (Note 4) |
Total Amount | 30,645 | 23,818 | -22.3% | 25,031 | +5.1% | 25,801 | +3.1% | 25,908 | +0.4% | 25,981 | +0.3% | -15.2% |
| Intensity | 0.102 | 0.079 | 0.083 | 0.086 | 0.086 | 0.087 | |||||||
| Adjusted Scope 1+2+3 | Total Amount | 31,405 | 24,546 | -21.8% | 25,750 | +4.9% | 26,477 | +2.8% | 26,553 | +0.3% | 26,595 | +0.2% | -15.3% |
| Intensity | 0.099 | 0.077 | 0.081 | 0.083 | 0.083 | 0.084 | |||||||
Water Usage Intensity (㎥/㎡) and Waste Volume Intensity (t/㎡)
| FY2019 | FY2020 | FY2021 | FY2022 | FY2023 | FY2024 | |||||||
|---|---|---|---|---|---|---|---|---|---|---|---|---|
| YoY | YoY | YoY | YoY | YoY | Difference (vs 2019) |
Water Usage Intensity | 3.833 | 2.147 | -44.0% | 2.448 | +14.0% | 3.265 | +33.4% | 3.610 | +10.6% | 3.784 | +4.8% | -1.3% |
| Waste Volume Intensity | 0.011 | 0.006 | -44.4% | 0.007 | +19.6% | 0.009 | +33.3% | 0.010 | +3.3% | 0.011 | +14.7% | +5.0% |
- (Note 1)
- In principle, the owner management scope refers to common areas of residences and retail facilities owned by INV.
- (Note 2)
- In principle, the tenant management scope refers to whole area of hotels and tenant-exclusive areas of residences and retail facilities owned by INV.
- (Note 3)
- Scope 1 covers direct greenhouse gas emissions from fuel consumption within the owner management scope, and Scope 2 covers indirect greenhouse gas emissions from electricity, heat, etc. purchased within the owner management scope. In addition, the target properties are those that (i) were held throughout the aggregation period and (ii) have data that enables comparison under the same conditions. Adjustments based on occupancy rates will be made on the actual values. Hereinafter the same.
- (Note 4)
- Scope 3 covers greenhouse gas emissions derived from tenant management scope.
- (Note 5)
- Each intensity is based on 95 properties (52 properties for waste volume intensity) in the portfolio that have been held from the beginning of FY2019 to the end of FY2024 and for which data that enables comparison under the same conditions can be obtained.
- (Note 6)
- Numbers may change due to revision of aggregation method.
Environmental Management System (EMS)
EMS Policy
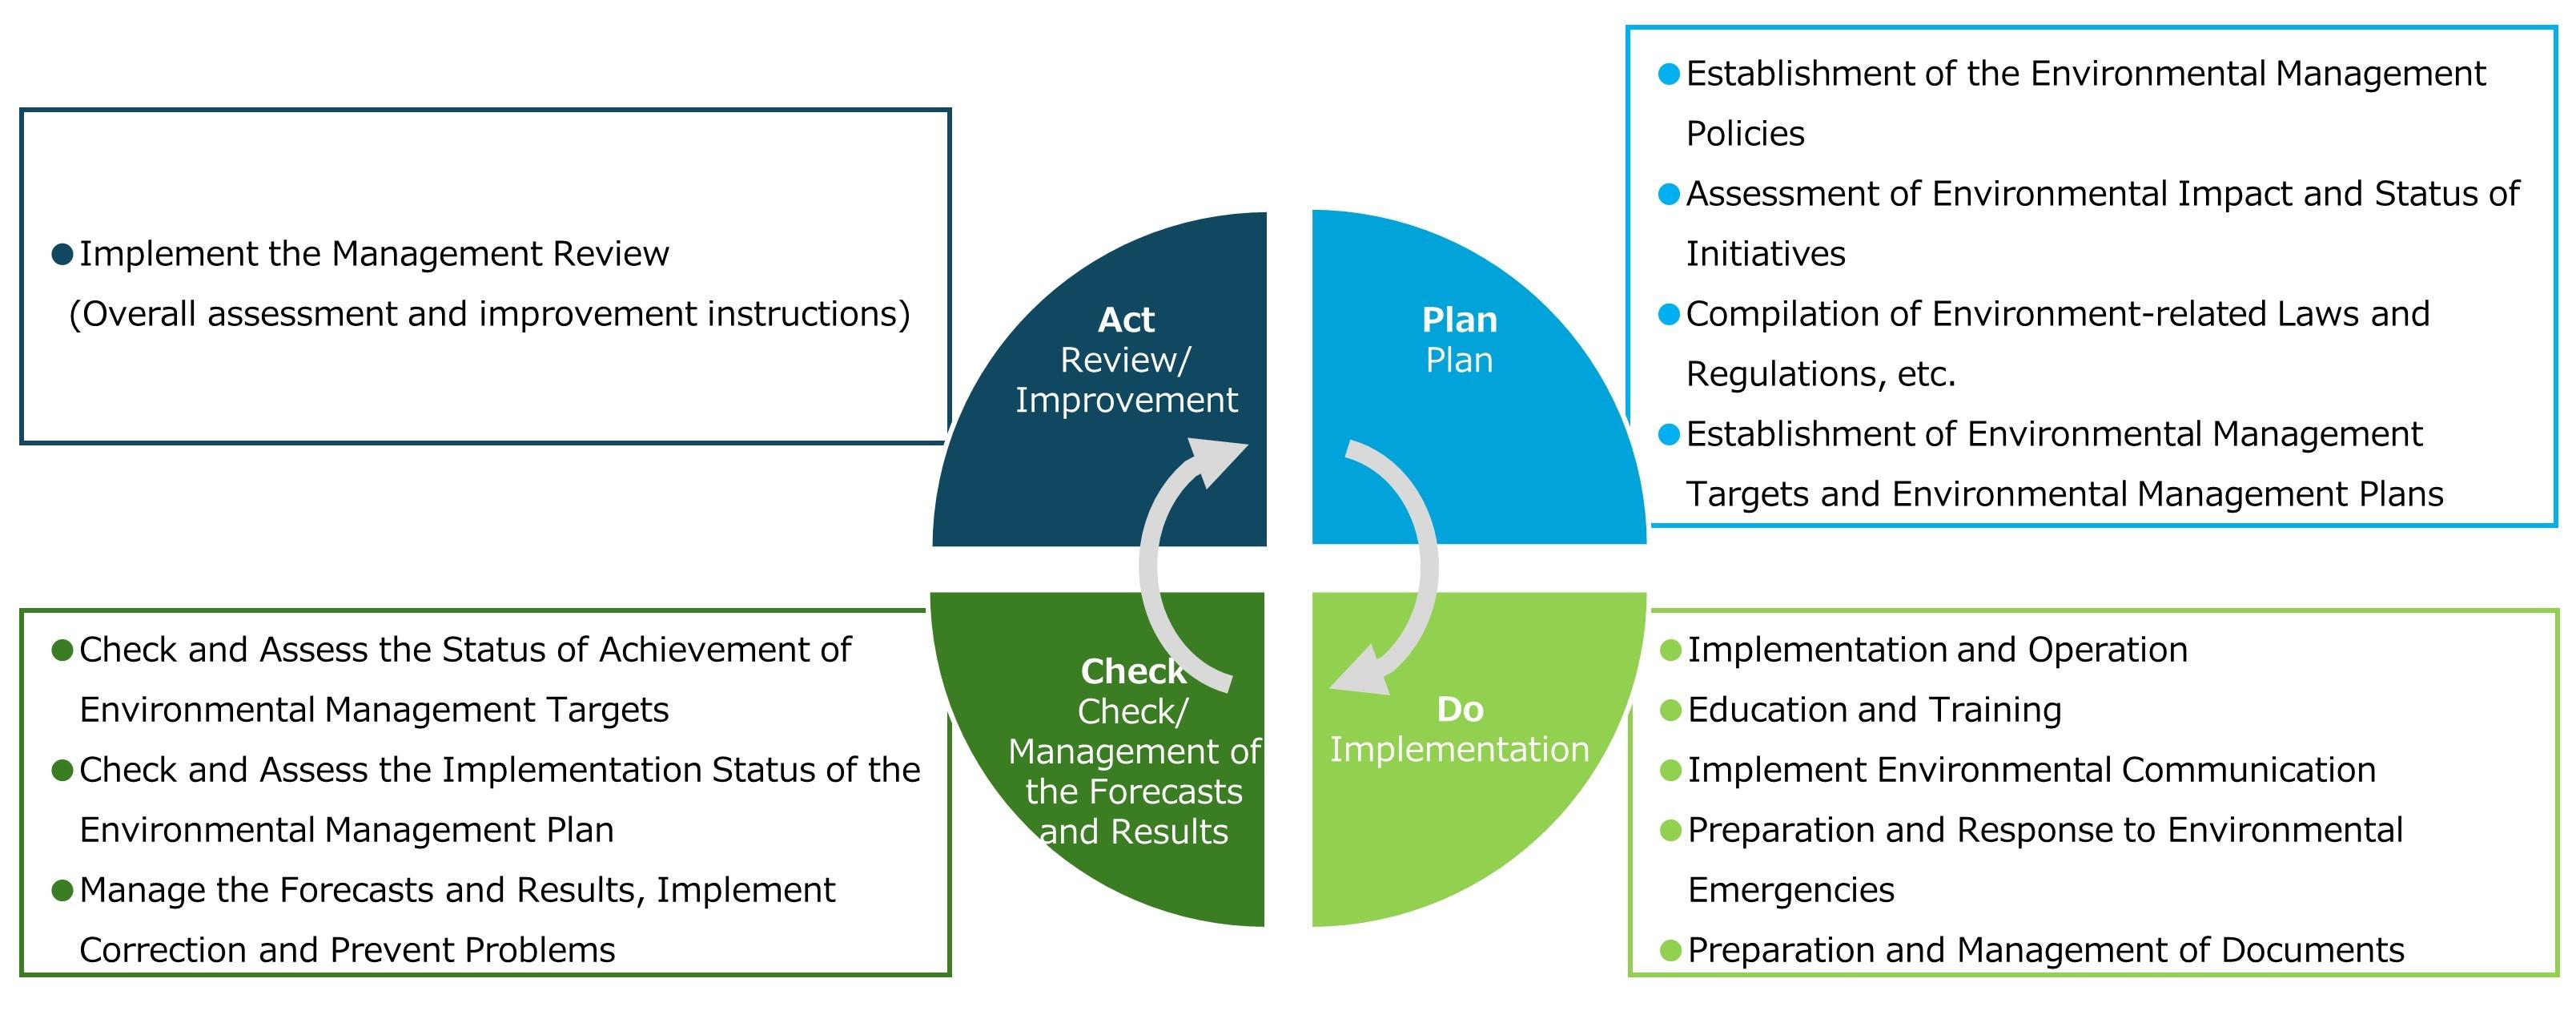
CIM recognizes energy conservation and reduction of GHG emission and others as important environmental issues for our real estate portfolio and is committed to addressing these issues in our sustainability policy. CIM has developed the "energy conservation policy", "GHG emission reduction policy", "water-saving policy" and "waste management policy" which define initiatives toward the reduction of environmental impact in the real estate investment management business. Furthermore, CIM has been working to reduce our environmental impact through PDCA (Plan/Do/Check/Act) cycle based on our EMS policy which specifies the details for managing these policies.
EMS diagram based on PDCA Cycle
Environmental Performance
The environmental performance of INV's portfolio for each fiscal year (April to March of the following year) is as follows.
| FY2019 Actual (Note 3) |
FY2020 Actual (Note 3) |
FY2021 Actual (Note 3) |
FY2022 Actual (Note 3) |
FY2023 Actual (Note 3) |
FY2024 Actual (Note 3) |
|||
|---|---|---|---|---|---|---|---|---|
| Coverage Ratio (Note 4) |
||||||||
| Number of Target Properties (Note 1) | 152 | 148 | 142 | 128 | 134 | 146 | - | |
| Energy Consumption | Total Amount (MWh) |
273,223 | 195,743 | 223,678 | 232,464 | 271,810 | 311,228 | 91.1% |
| Intensity (MWh/㎡) |
0.358 | 0.261 | 0.300 | 0.322 | 0.347 | 0.325 | ||
| Renewable Energy (MWh: included in total amount) |
3,797 | 3,695 | 3,505 | 4,355 | 3,465 | 3,417 | 18.1% | |
| Greenhouse Gas Emissions |
Total Amount (t-CO2eq) |
80,618 | 58,250 | 63,321 | 65,222 | 76,768 | 90,124 | 91.1% |
| Intensity (t-CO2eq/㎡) |
0.105 | 0.077 | 0.085 | 0.090 | 0.098 | 0.094 | ||
| Water Usage | Total Amount (㎥) |
2,821,557 | 1,712,511 | 1,944,347 | 2,595,546 | 3,323,857 | 3,960,463 | 91.5% |
| Intensity (㎥/㎡) |
3.637 | 2.253 | 2.578 | 3.582 | 4.226 | 4.125 | ||
| Waste Volume | Total Amount (t) |
7,150 | 4,282 | 5,180 | 5,302 | 6,140 | 9,405 | 83.1% |
| Intensity (t/㎡) |
0.010 | 0.006 | 0.007 | 0.007 | 0.008 | 0.010 | ||
| Recycling Rate (Note 2) (%) |
20.9 | 19.4 | 17.3 | 25.1 | 21.0 | 20.6 | ||
- (Note 1)
- Properties acquired or sold during the relevant period are included.
- (Note 2)
- Recycling rate (%) is calculated by dividing the recycled weight (t) by the total weight of waste (t). Hereinafter the same shall apply.
- (Note 3)
- Actual value of each property is based on the data during the holding period by INV. For co-ownership properties, actual value of the entire property is reported regardless of INV's ownership ratio. Hereinafter the same shall apply.
- (Note 4)
- Coverage ratio (%) is calculated by dividing floor area of the portion where the data was collected (㎡) by total floor area (㎡).
The following are actual values (Note 1) for properties in INV's portfolio that can be compared under the same conditions (Note 2).
| FY2019 | FY2020 | FY2021 | FY2022 | FY2023 | FY2024 | ||||||||
|---|---|---|---|---|---|---|---|---|---|---|---|---|---|
| YoY | YoY | YoY | YoY | YoY | Difference (vs 2019) |
||||||||
| Energy Consumption (95 properties) |
Total Amount (MWh) |
99,887 | 79,523 | -20.4% | 83,550 | +5.1% | 91,122 | +9.1% | 91,220 | -0.1% | 92,812 | +1.7% | -7.1% |
| Intensity (MWh/㎡) |
0.315 | 0.251 | 0.263 | 0.287 | 0.288 | 0.293 | |||||||
| Renewable Energy (MWh: included in total amount) |
2,118 | 2,208 | +4.3% | 2,135 | -3.3% | 2,248 | +5.3% | 2,170 | -3.5% | 2,109 | -2.8% | -0.4% | |
| Greenhouse Gas Emissions (95 properties) |
Total Amount (t-CO2eq) |
31,406 | 24,545 | -21.8% | 25,750 | +4.9% | 26,478 | +2.8% | 26,554 | +0.3% | 26,595 | +0.2% | +15.3% |
| Intensity (t-CO2eq/㎡) |
0.099 | 0.077 | 0.081 | 0.083 | 0.083 | 0.084 | |||||||
| Water Usage (95 properties) |
Total Amount (㎥) |
1,213,482 | 679,860 | -44.0% | 774,985 | +14.0% | 1,033,493 | +33.4% | 1,142,806 | +10.6% | 1,197,748 | +4.8% | -1.3% |
| Intensity (㎥/㎡) |
3.833 | 2.147 | 2.448 | 3.265 | 3.610 | 3.784 | |||||||
| Waste Volume (52 properties) |
Total Amount (t) |
3,275 | 1,820 | -44.4% | 2,177 | +19.6% | 2,903 | +33.3% | 2,998 | +3.3% | 3,439 | +14.7% | +5.0% |
| Intensity (t/㎡) |
0.011 | 0.006 | 0.007 | 0.009 | 0.010 | 0.012 | |||||||
| Recycling Rate (%) |
23.1 | 26.5 | +3.4pt | 21.9 | -4.6pt | 21.2 | -0.7pt | 12.3 | -8.9pt | 19.5 | -17.2pt | -3.6pt | |
- (Note 1)
- A certain adjustment has been made by CIM.
- (Note 2)
- Properties that have been held from the beginning of FY2019 to the end of FY2024 and for which data that enables comparison under the same conditions can be obtained. The following properties are excluded because it is difficult to make an adjustment for comparison under the same conditions: (i) properties acquired or sold during the relevant period, (ii) properties for which the occupancy rate has not been disclosed to INV, (iii) properties with a month when the occupancy rate became 0% due to a temporary closure. The number of target properties for each item of the environmental data is shown in parenthesis under each item name.
Initiatives for Green Buildings
In order to promote initiatives for green buildings, the real estate that is environmentally and socially friendly, INV has implemented the following renovations in our portfolio and introduced effective equipment to reduce environmental impact, such as promoting energy conservation, reducing CO2 emissions, and effectively utilizing water resources.
- Introduction of large-scale energy-saving equipment (cold/hot water generator, hot water heater, etc.)
- Water saving by recycling pool drainage
- Introduction of LED lighting
- Introduction of the water-saving type toilet
- Installation of a water-saving shower
- Installation of gas cogeneration, inverter, etc.
- Automatic meter readings (AMR)
- Introduction of BEMS
- Installation of high-efficiency equipment and appliances
- Introduction of on-site renewable energy
Green Lease
Green lease is an initiative in which owners and tenants of a real estate asset voluntarily agree in a lease contract to work together on measures related to the environmental consideration of the real estate and put them into practice. INV has been actively adopting green lease and, together with the agreed tenants, has been actively maintaining and improving the environmental performance of INV's properties.
Track record of concluding green leases with the agreed tenants including INV's main tenant, Iconia Hospitality K.K. ("ICN")(Note 1) that operates most of INV's hotels as of the end of March 2025
Number of hotels: 97
Total floor area ratio covered in the entire portfolio: 73.0%
- (Note 1)
- MYSTAYS HOTEL MANAGEMENT Co., Ltd. changed its company name for Iconia Hospitality K.K. as of July 1, 2025.
Distribution of Sustainability Guides for Tenants
We distribute examples of initiatives on "sustainable hotel management" to hotel operators, who are tenants, and encourage them to work to reduce the environmental impact of hotel management and raise environmental awareness among guests.
Initiatives by Hotel Operator
ICN, the main operator of hotels owned by INV has been implementing various initiatives to promote energy savings and CO2 reduction related to hotel operations and to preserve biodiversity in the surrounding areas.
Energy-saving construction using Ministry of the Environment subsidy (SHIFT Project)
Four hotels (Hotel MyStays Nagoya-Sakae, Hotel MyStays Ueno East, Hotel Epinard Nasu and Hotel MyStays Gotanda Station) received subsidies of JPY 96.8 million in total (about one-third of the total investment) from the Ministry of the Environment's "Project for the Promotion of Leading Decarbonization Initiatives in Factories and Business Sites (SHIFT Project*)" by replacing oil- and gas-fueled boilers with more environmentally friendly and energy-efficient.
Seven hotels including Kamenoi Hotel Beppu, Hotel MyStays Sapporo Aspen and Hotel Nord Otaru have implemented energy-saving construction work with SHIFT project. ICN aims to reduce CO2 emissions as well as running costs by leveraging subsidies such as SHIFT project.

Various Initiatives for Energy Conservation and CO2 Reduction
- Eco-friendly plan at hotel "ECO-Plan"
Encouraging guests to use eco-friendly plans by lowering the price of plans that do not require linen exchange when guests stay 7 consecutive nights
- Conducted energy-saving checks
- Reducing greenhouse gas emissions from Food Transportation at Hotels (Hotel Epinard Nasu)
Contributing to CO2 reductions by cooperating with farmers and dairy farmers in Tochigi Prefecture to reduce the procurement from prefectures other than Tochigi

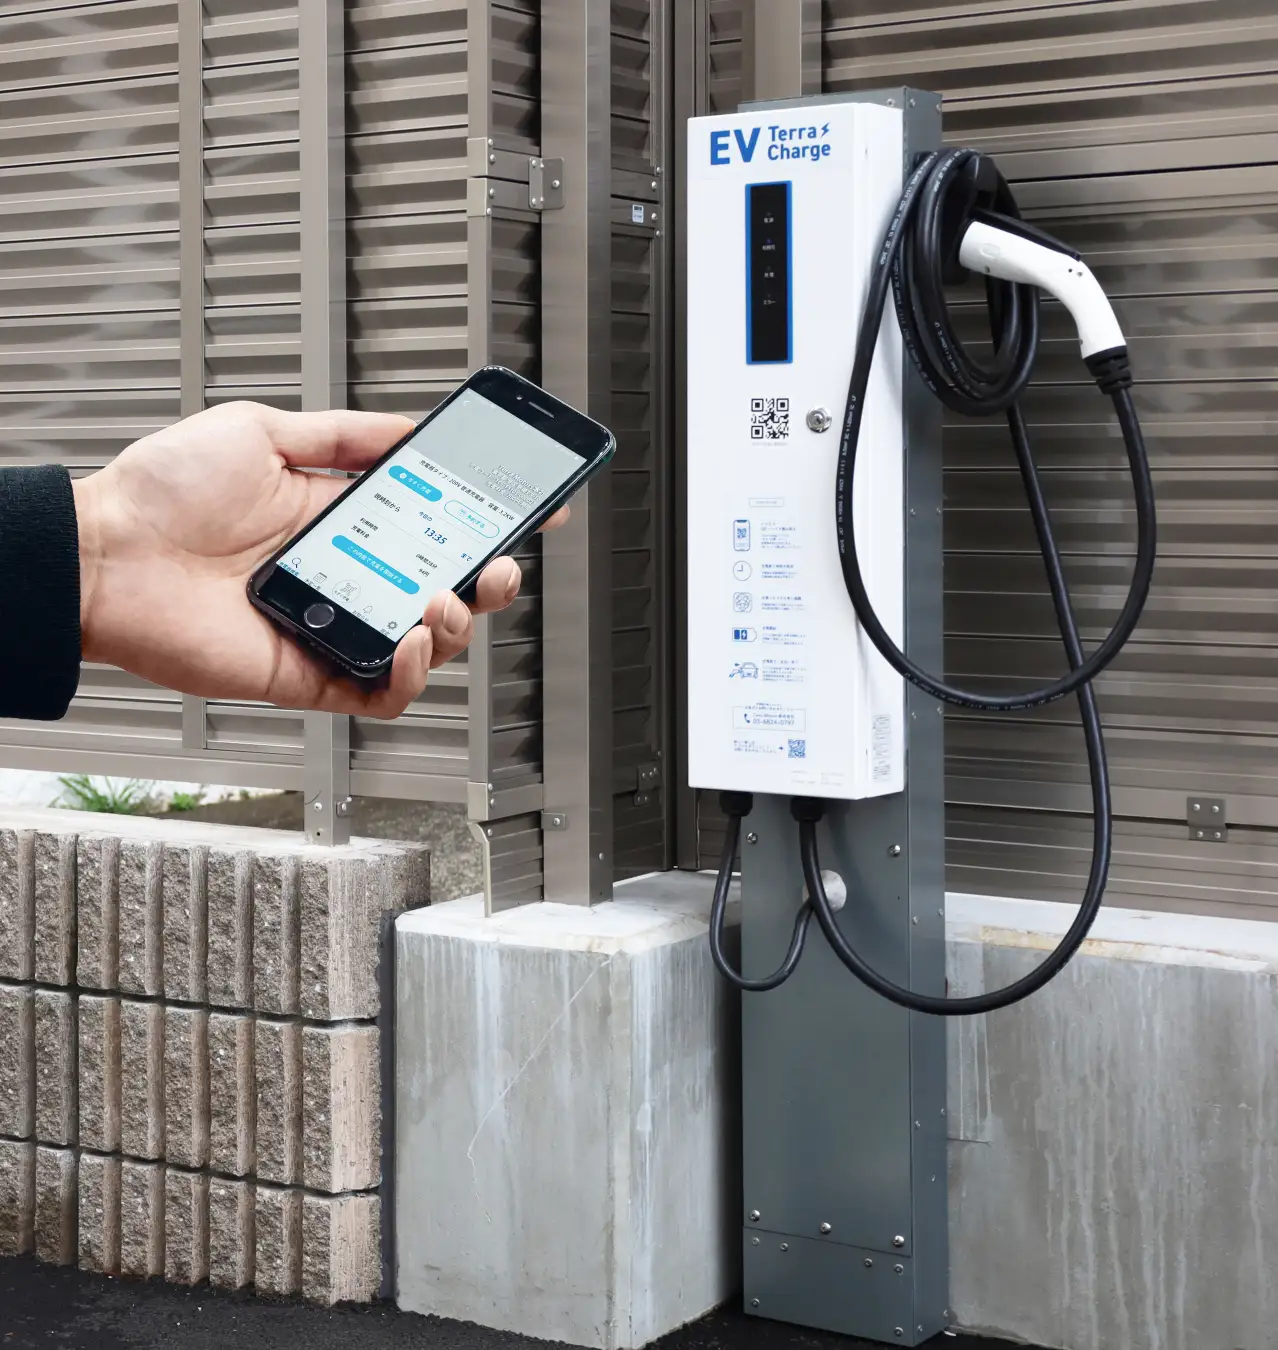
Introduction of EV infrastructure "Terra Charge"
Decided to introduce EV charging infrastructure "Terra Charge" provided by Terra Motors Corporation in most of hotels operated by ICN as one of the measures to achieve a decarbonized society. 156 units will be installed at 90 hotels, and will be gradually expanded to hotels across Japan to protect the environment and improve convenience of hotel guests.
(as of April 22, 2025)
Hotel brand
# of hotels to be
introduced
# of units to be
introduced
Hotel MyStays Premier
4
7
Hotel MyStays
22
32
Flexstay Inn
1
2
Art Hotel
10
13
Iconia Collection
19
26
Kamenoi Hotel
37
69
Total
93
149
Biodiversity Initiative
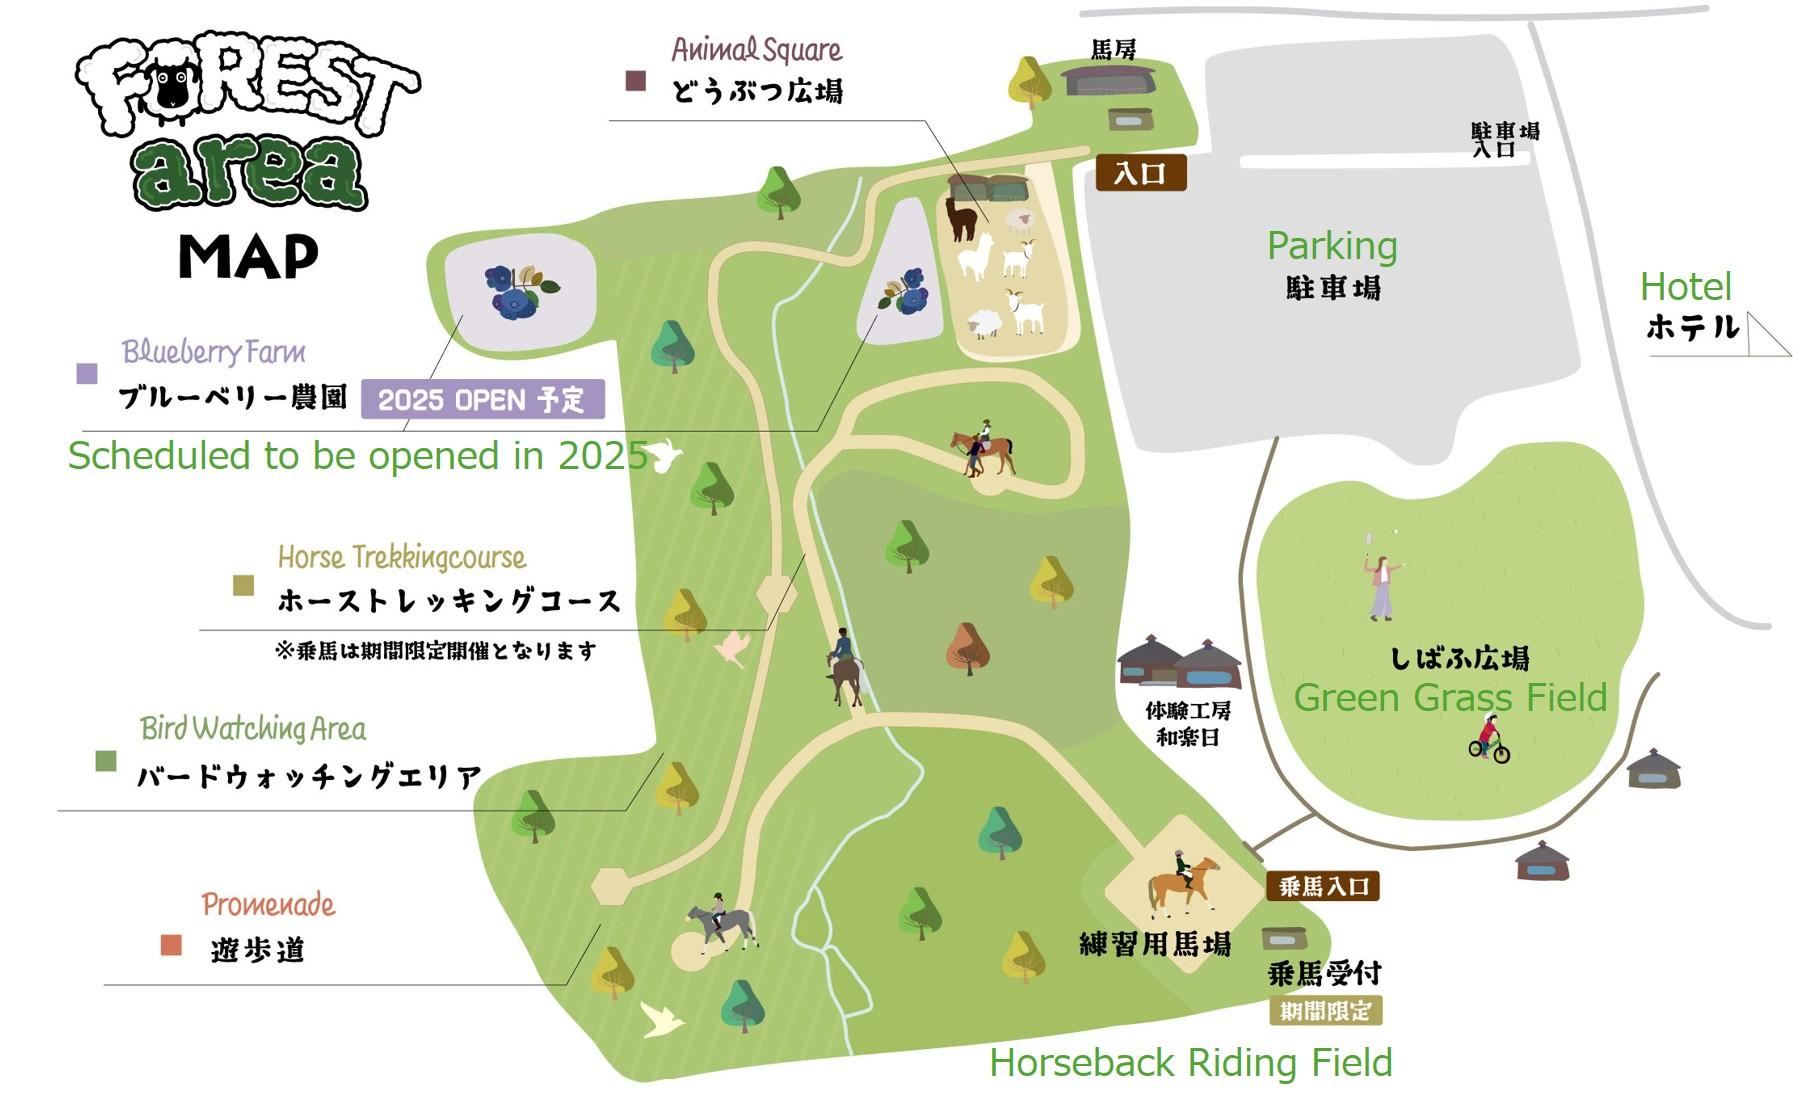
Hotel Epinard Nasu
In order to reduce the impact of deforestation on the ecosystem, tree felling was minimized during hotel development. In the blueberry farm area scheduled to be opened in 2025, we are working to conserve the forest by planting more blueberries than were cut down. Furthermore, hotel provides the activities and nature tours that guests can enjoy in the rich natural forest which is home to insects and small animals.
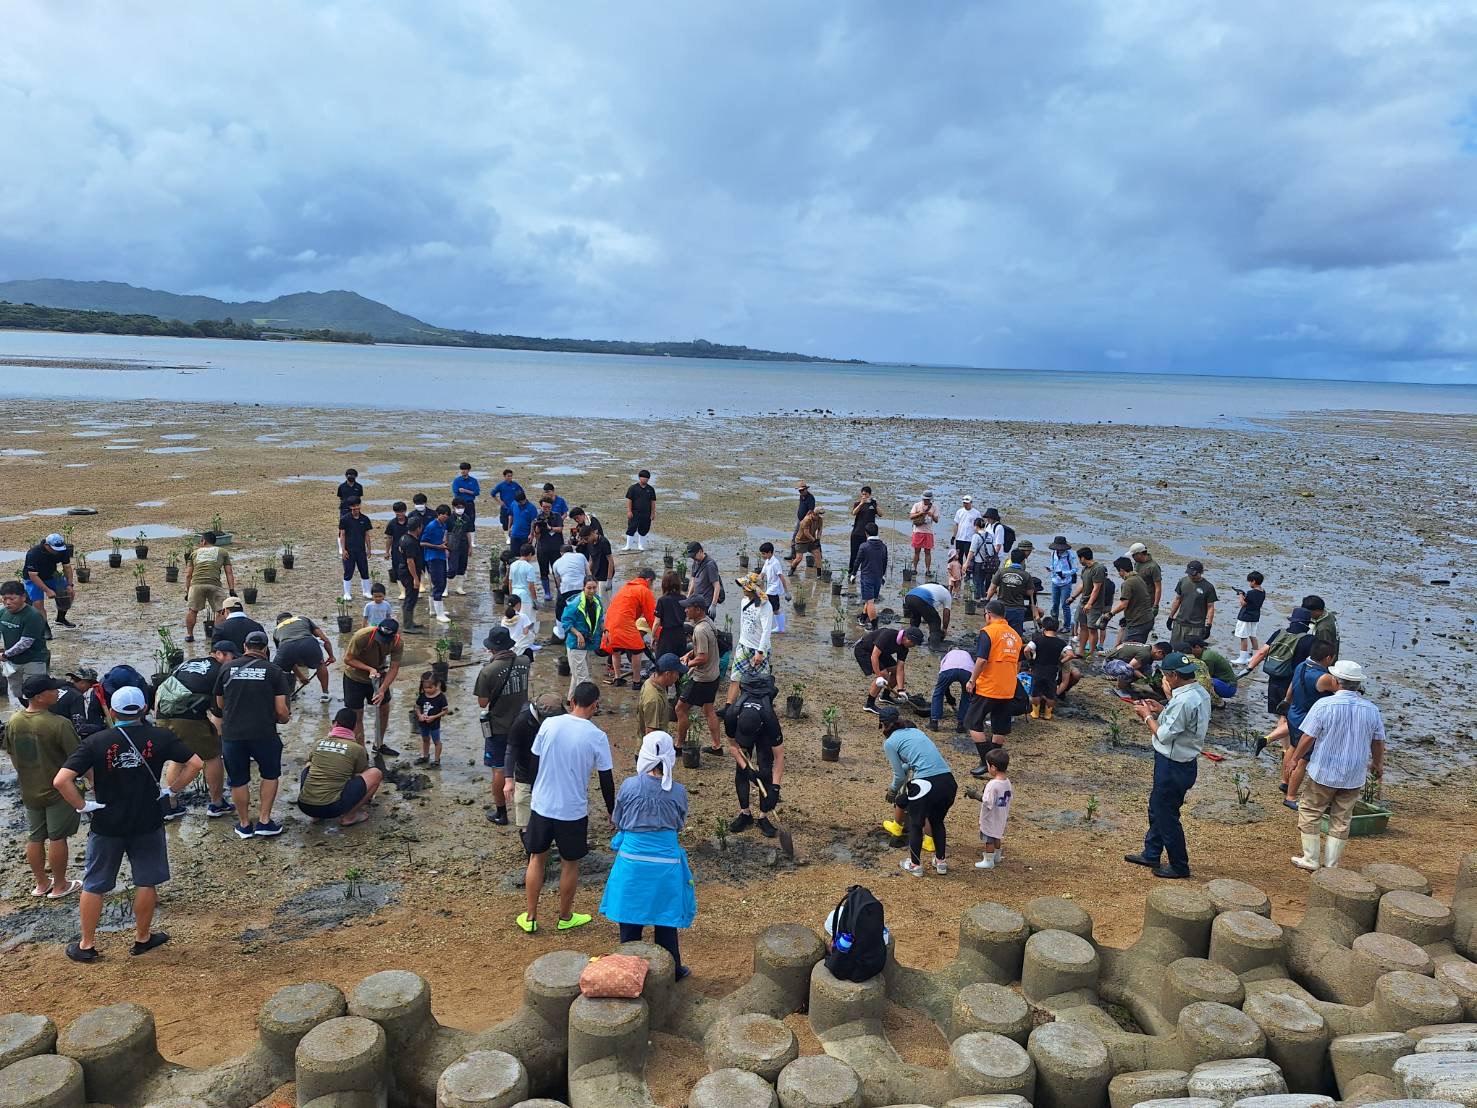
Art Hotel Ishigakijima
Participated in forestation activities of mangroves organized by Lions Club of local area. It is said that mangrove helps to reduce effect of global warming by absorbing CO2 and store carbon which are main factor of global warming. Furthermore, it also serves as a "green breakwater" that protects people's lives and ecosystems from natural disasters such as tidal waves and tsunamis.
Fusaki Beach Resort Hotel & Villas
With the aim of preserving the rich nature of Ishigaki Island, from June 13, 2022, we are replacing toothbrushes and hairbrushes made with 100% plant derived materials that biodegrade in seawater. In addition, the razors provided to guests have been replaced by the ones containing renewable biological resources consisting of waste parts of wheatgrass. Furthermore, plastic packaging was changed to paper packaging in the aim of reducing the amount of plastic waste.

Biodiversity Initiatives by other hotel operators
The Westin Grand Cayman Seven Mile Beach Resort & Spa
Collaborates with "Beneath the Waves Foundation" who are working with the Cayman Islands Department of Environment to establish a deep-sea marine protected area in The Cayman Trench, the deepest point of the Caribbean Sea, and contributes to ocean conservation through nature-based solutions to climate change. Furthermore, the hotel provides groups and leisure guests an opportunity for turtle releases with "The Cayman Islands Turtle Centre". Sea turtles have a positive impact on the marine ecosystem as well as the beach and dune ecosystems. Turtle releases ensure that the turtle is older when it reaches the water, increasing their survival rate, and contributing to a healthy marine environment.
ICN, the main operator of hotels owned by INV has been implementing various initiatives to promote energy savings and CO2 reduction related to hotel operations and to preserve biodiversity in the surrounding areas.
Energy-saving construction using Ministry of the Environment subsidy (SHIFT Project)
Four hotels (Hotel MyStays Nagoya-Sakae, Hotel MyStays Ueno East, Hotel Epinard Nasu and Hotel MyStays Gotanda Station) received subsidies of JPY 96.8 million in total (about one-third of the total investment) from the Ministry of the Environment's "Project for the Promotion of Leading Decarbonization Initiatives in Factories and Business Sites (SHIFT Project*)" by replacing oil- and gas-fueled boilers with more environmentally friendly and energy-efficient.
Seven hotels including Kamenoi Hotel Beppu, Hotel MyStays Sapporo Aspen and Hotel Nord Otaru have implemented energy-saving construction work with SHIFT project. ICN aims to reduce CO2 emissions as well as running costs by leveraging subsidies such as SHIFT project.
Various Initiatives for Energy Conservation and CO2 Reduction
- Eco-friendly plan at hotel "ECO-Plan"
Encouraging guests to use eco-friendly plans by lowering the price of plans that do not require linen exchange when guests stay 7 consecutive nights - Conducted energy-saving checks
- Reducing greenhouse gas emissions from Food Transportation at Hotels (Hotel Epinard Nasu)
Contributing to CO2 reductions by cooperating with farmers and dairy farmers in Tochigi Prefecture to reduce the procurement from prefectures other than Tochigi
Introduction of EV infrastructure "Terra Charge"
Decided to introduce EV charging infrastructure "Terra Charge" provided by Terra Motors Corporation in most of hotels operated by ICN as one of the measures to achieve a decarbonized society. 156 units will be installed at 90 hotels, and will be gradually expanded to hotels across Japan to protect the environment and improve convenience of hotel guests.
(as of April 22, 2025)
| Hotel brand | # of hotels to be introduced |
# of units to be introduced |
|---|---|---|
| Hotel MyStays Premier | 4 | 7 |
| Hotel MyStays | 22 | 32 |
| Flexstay Inn | 1 | 2 |
| Art Hotel | 10 | 13 |
| Iconia Collection | 19 | 26 |
| Kamenoi Hotel | 37 | 69 |
| Total | 93 | 149 |
Biodiversity Initiative
Hotel Epinard Nasu
In order to reduce the impact of deforestation on the ecosystem, tree felling was minimized during hotel development. In the blueberry farm area scheduled to be opened in 2025, we are working to conserve the forest by planting more blueberries than were cut down. Furthermore, hotel provides the activities and nature tours that guests can enjoy in the rich natural forest which is home to insects and small animals.
Art Hotel Ishigakijima
Participated in forestation activities of mangroves organized by Lions Club of local area. It is said that mangrove helps to reduce effect of global warming by absorbing CO2 and store carbon which are main factor of global warming. Furthermore, it also serves as a "green breakwater" that protects people's lives and ecosystems from natural disasters such as tidal waves and tsunamis.
Fusaki Beach Resort Hotel & Villas
With the aim of preserving the rich nature of Ishigaki Island, from June 13, 2022, we are replacing toothbrushes and hairbrushes made with 100% plant derived materials that biodegrade in seawater. In addition, the razors provided to guests have been replaced by the ones containing renewable biological resources consisting of waste parts of wheatgrass. Furthermore, plastic packaging was changed to paper packaging in the aim of reducing the amount of plastic waste.
Biodiversity Initiatives by other hotel operators
The Westin Grand Cayman Seven Mile Beach Resort & Spa
Collaborates with "Beneath the Waves Foundation" who are working with the Cayman Islands Department of Environment to establish a deep-sea marine protected area in The Cayman Trench, the deepest point of the Caribbean Sea, and contributes to ocean conservation through nature-based solutions to climate change. Furthermore, the hotel provides groups and leisure guests an opportunity for turtle releases with "The Cayman Islands Turtle Centre". Sea turtles have a positive impact on the marine ecosystem as well as the beach and dune ecosystems. Turtle releases ensure that the turtle is older when it reaches the water, increasing their survival rate, and contributing to a healthy marine environment.